

What Is Infographic And How To Double Your Website Traffic With Infographics
So, what is Infographic? According to Wikipedia, infographics are visual representations of information, data, or knowledge intended to present complex information quickly and clearly. In other words, infographics are a way of presenting information that is uncomplicated and easy to read.
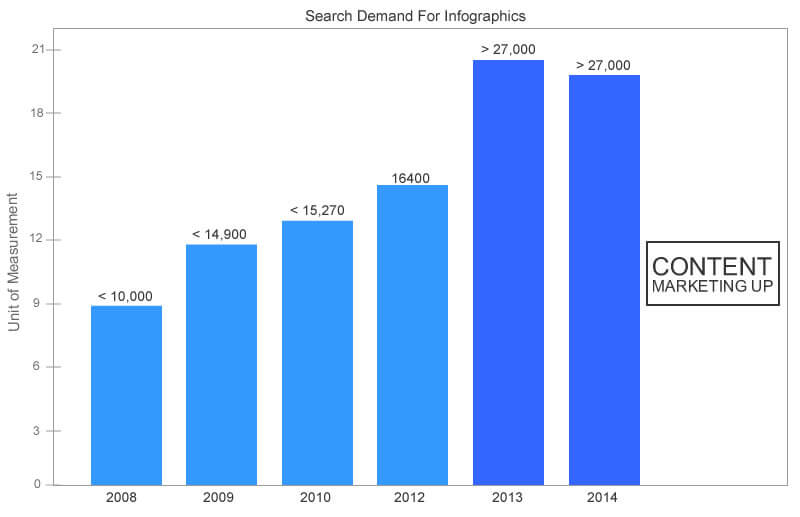
You may have seen infographics while surfing the net or on social media. They are simple, easy to understand, and interesting to read. Nowadays, infographics rule the internet. According to Unbounce, the demand for infographics has increased by 800% in the last two years.
Recent research by WebMD stated that a human brain can register visual information 60,000 times faster than normal text. In addition, 65% of people are visual learners.
Infographics can certainly double your website traffic if you do them right. However, not all infographics go viral. There are some important factors you should take into account when creating infographics for marketing purposes.
The Method You Use
How you visually present the collected data in your infographic is a very important part of the process. You can use graphs or flow charts, for example, but make sure you consider how the audience will perceive the data.
Another important factor is the title you give your infographic. For instance, if the infographic is a how-to,you should title it accordingly.
Use Correct Statistical Data
Your content should be statistically correct or verified from a reliable source. You won’t convince your audience with information based on your personal opinions so don’t base your infographic on them.
Develop a Unique View
Use a unique approach for your infographic. For example, don’t follow the same format your competitors use. Instead, your infographics should have interesting graphics and characters that tell a unique story that is quick to read.
Pick the Right Topic
Choose interesting topics that people will love to read. It is not easy to grab the reader’s attention unless you have a trending topic to talk about. The best way to achieve this is to search for topics on Google Trends to find out what people are talking about.
Create Useful and Shareable Infographics
Creating useful infographics means providing readers with a deep insight into the topic that they can read and understand in short span of time.
According to Buzzsumo, content with images gets the most shares. In addition, infographics are among the most shared content on the internet as people share what they find useful.’
The Design of Your Infographics
Make sure you get your infographic professionally designed. After all, if you have good-quality content but don’t have an attractive design, your infographic will fail. This is often because people will be hesitant to share the infographic. So, it is best to get it designed by a professional graphic designer.
Generating an embed code
Use an embed code generator to make it easy for users to share and embed your infographic. When you do, your infographic will have a link back to your original social media page or website. This will bring you additional traffic.
Conclusion
Infographics definitely increase traffic. It is best to use them to optimize your website for conversions so you generate more leads and sales. You can attach promotional messages with your infographics as well, to market your business.
Comments are closed.